The PhD program TRIBE ('Translational Research in Biomedicine') at the University of Split offers a primer in applied statistics. Learn how to love statistics!
Lecturer: Michael Gratwohl, assistant professor for Energy Finance, University of St. Gallen
Objective:
Outline
Audience: Ph.D. students in biomedicine, 1st/2nd year, basic/moderate knowledge
Date: April 11-15, 2016
Language: English
Preparation: Bring your own data
Schedule: 4 afternoons
Structure: Theory, practical work, discussion
Day 1 Preparation
Realization and descriptive statistics: correlations, moments, structure
Estimated underlying distribution: probability density and cumulative distribution
Optimization criteria: mathematical arguments and the role of preferences
Goal Master standard descriptive statistics and deduce tender points thereof.
PPT: Descriptive information as the gauge for hypothetical distributions
Day 2 Analysis
Problem statement: formulating the desired result in a testable way
Central limit theorem: the magic of the normally distributed sample means
Hypothesis testing: statement, interpretation, and justification
Goal Formulate your problem statement and understand 'significance'.
PPT: Hypothesis testing as the scientific path for significant results
Day 3 Interpretation
Correlation: causality from content, not statistics
Linear regression: standard ordinary least squares (OLS)
Transformations: necessities and consequences for the error term
Goal Discern correlation and causality and set up a meaningful OLS model.
PPT: Relations between variables as indications for explanations
Day 4 Presentation
Driving your point home: visual support or manipulation?
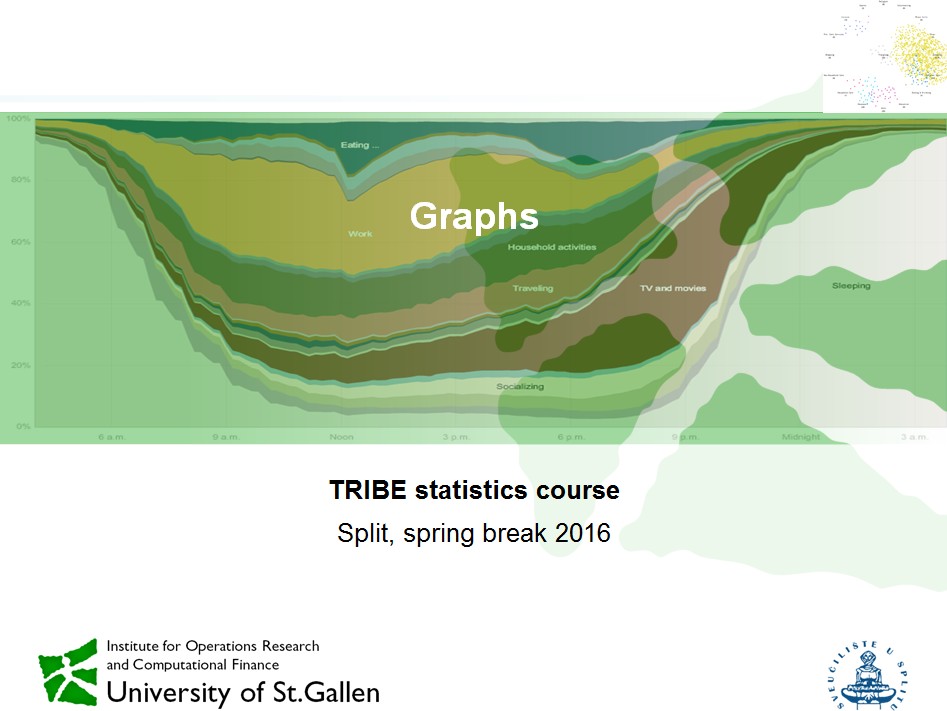
Graphs: alternatives for distributions, proportions, models, time series, shares
Statistical information: empirical or estimated confidence intervals
Goal Realize the power of framing and depiction to make your point
PPT: Text, tables, and pictures for a convincing message
Other online material
Welcome, everyone, and enjoy the course material


